|
Academic Research Journal
of Agricultural Science and Research Vol. 1(1), pp. 1-6,
November,
ISSN: 2360-7874 ©2014 Academic Research
Journals
Full
Length Research Paper
STUDIES
ON GENETIC VARIABILTY IN SOME SWEET SORGHUM (Sorghum bicolor L Moench)
GENOTYPES
Sami,
R. A., Yeye M. Y., Usman I. S. Hassan L. B. and Usman M.
Department of Plant
Science, Ahmadu Bello University, Zaria, Nigeria.
Corresponding author:
rasami@abu.edu.ng ,
+2348036121981.
Accepted 13 November,
2013
Studies were carried out to estimate the extent of genetic
variability in some cultivated genotypes of sweet sorghum (sorghum
bicolor L Moench). Thirty genotypes were evaluated in 2011 rainy
season across two locations, to obtain more information on their
genetic and morphological diversity. Significant mean squares were
obtained for 10 traits in the individual analysis and also for the
combined analysis across locations, suggesting that this sweet
sorghum population was highly variable for some of the characters
and as such will respond to selection. Mean performances for the
combined analysis identified ICSV 93046, (SW DAURA 06-5-2 &ICSV700),
SPV 422, ICSV700, (SW DAURA 06-5-2 & 38A x NR71182), SW DAURA
06-5-2, (SW DAURA 06-5-4 & E36-1), 38A*NR71182, and (SW KEBBI 07-5 &
SPV 422) as the best genotypes in terms of days to 50% flowering,
plant height, stem thickness, number of nodes, number of leaves,
panicle weight, 1000 grain weight, grain yield and sugar content.
Key words: Variance, heritability, sweet sorghum
INTRODUCTION
Sweet sorghum (Sorghum bicolor (L) Moench) is the same species as grain
sorghum, grass sorghum and broom sorghum (Doggett, 1970). Sorghum grain
is the fifth most important cereal in the world after wheat, rice, maize
and barley. In Africa it comes second after maize in terms of production
(FAO, 2011). According to FAO (2011) estimates, the average world
production of sorghum amounted to 66 million tonnes. Also according to
Agricultural performance Survey of 2011 Wet Season in Nigeria, Sorghum
production decline slightly from 7.02 to 6.89 million tons because the
land area under cultivation decreased slightly from 5.04 million
hectares to 4.89 million hectares. There is a need to improve overall
income from sorghum through improving productivity or increasing value
by locating and exploiting alternative uses. Sweet sorghum is similar to
commonly grown grain sorghum with an increased potential to accumulate
sugars in the stalk. The global energy demand and volatile prices of
fossil fuels has forced nations to search for new alternative energy
sources. Sweet sorghum, with its short growing period (four months), low
water requirement, high biomass and alcohol production potential and
greater income potential from cultivation, is thus a preferred raw
material for generating energy. In addition to its sweet-stalk, it has a
grain yield of about 2.0 to 6.0 t ha–1 (which can be used as food or
feed) when harvested. Progress in plant breeding, depends on the extent
of genetic variability present in the population. Therefore the first
step in any breeding program is the study of the genetic variability
present This cannot easily directly measured as the phenotypic
expression reflects non-genetic as well as genetic influences. The
genetic basis must be inferred from the phenotypic observations which
are the results of interactions of genotype and environment.
MATERIALS AND METHODS
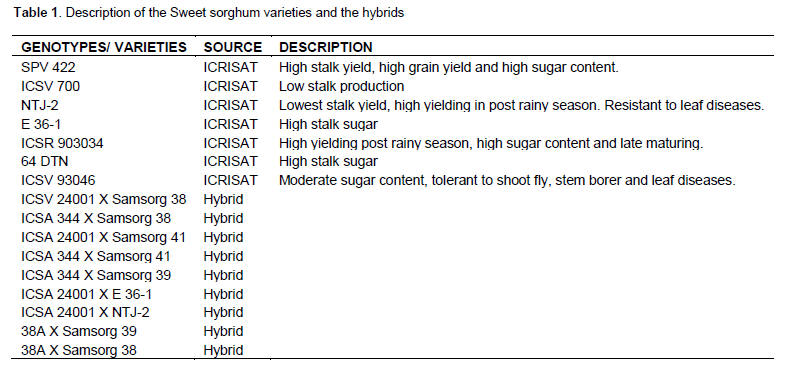
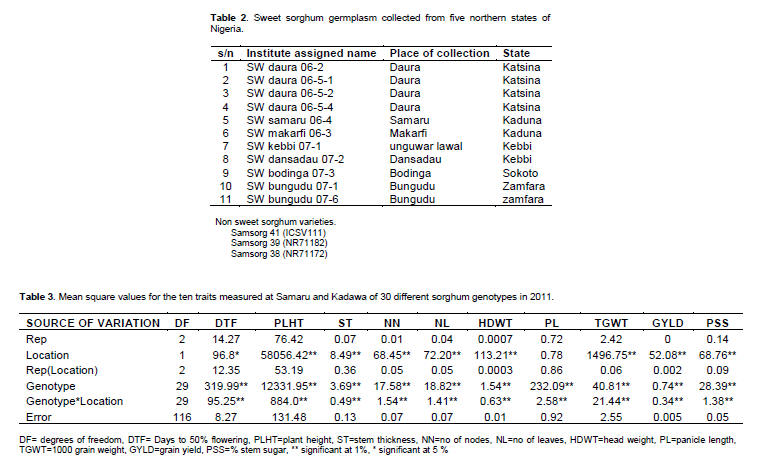
Thirty genotypes were used for this study: seven of these were obtained
from India, eleven locally collected across Nigeria, nine genotypes
resulted from crosses done and three non-sweet varieties were included
from the Institute for Agricultural Research (IAR), Samaru, Zaria.
The genotypes/varieties were planted during the 2011 rainy seasons at
two locations for evaluation in replicated trials. The Research Farm of
the Institute for Agricultural Research (IAR), Ahmadu Bello University
(ABU) Samaru Zaria (11 011’N, 07 0 38’E, 686 m above sea level) in the
northern Guinea Savanna ecological zone of Nigeria; and the Irrigation
Research Station, Kadawa of IAR/ABU (11 0 39’, 080 027’ E and 500 m
above sea level), in the Sudan Savanna ecological zone of Nigeria.
At each location, the 30 genotypes/varieties were grown in a randomized
complete block design with three replications. Each of the 30 plots
consisted of 4 ridges each of which measured 5m long and were spaced
0.75m apart with 0.25m within row spacing. Proper local agronomic
practices for sorghum were carried out. The two inner rows were used for
data collections and observation for each plot. The data collected
include:
Days to 50% flowering: - the number of days from sowing to the time when
50% of the Plants flowered.
Number of leaves: - was taken by counting the number of leaves from the
base to the flag leaf of 6 plants taken from the two central rows and
taking the average.
Plant height: -was measured in cm using meter rule from the base of the
plant to the top of the panicle.
Stem thickness: - the diameter of the stem of six ramdomly selected
plants per plot and the mean taken. It was measured in cm using vanier
caliper.
Number of nodes: -number of nodes on the plant from base to top taking 6
plants from the two central rows by counting the nodes.
Panicle length: - the length from the base of the panicle to the tip
measured in cm using a meter rule.
Panicle weight: - weight of the total number of heads harvested from the
two central rows in grams using measuring scale.
Grain yield/plot: - after threshing and adequate drying, record the
grain weight per plot to the nearest grams from the two central rows.
1000g grain weight: - the weight of 1000gram grains after threshing.
Percentage sugar content: - some parts of the stem were taken within
each plot and analyzed at the Product Development Programme Unit
Laboratory of IAR.
The genotypes used for this study are listed in Table 1 and 2.
The data obtained were subjected to analysis of variance for each
location based on plot means followed by combined analysis of data
across the two locations; these were done according to methods described
by Singh and Chaudhary (1985). Mean separation was carried out according
to Duncans multiple range test (DMRT) described by Duncans (1955). Also
components of variance (σ2p, σ2e, σ2g) were used for the estimation of
coefficients of variation (PCV, GCV) as described by Singh and Chaudhary
(1985)
RESULTS AND DISCUSSIONS
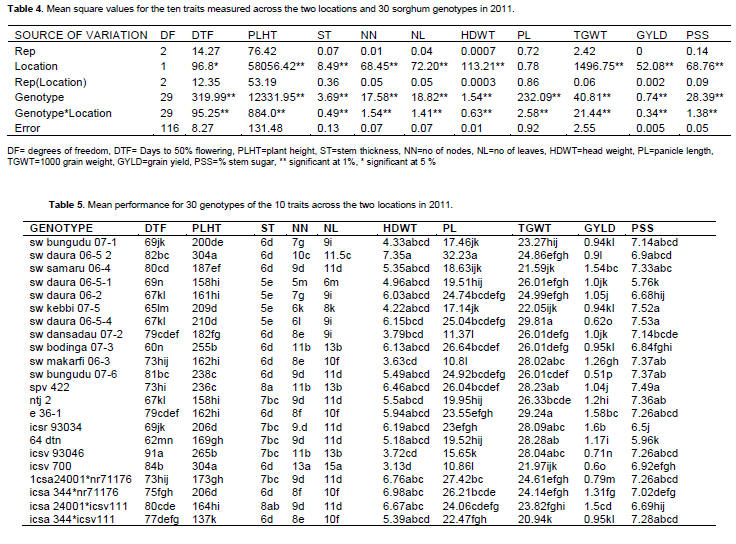
The significant mean values obtained from the analysis of variance for
the individual location suggests that differences existed the sorghum
genotypes/ varieties for most traits, indicating that they are highly
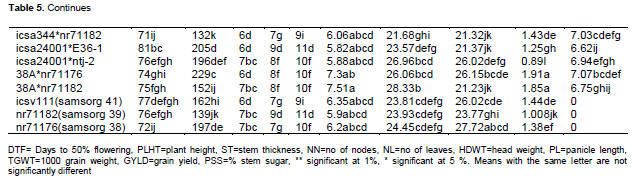
variable (Table 3). The significant mean square values obtained for the
location (Table 4), for some of the traits indicated that the conditions
in the two locations were not similar in many ways and that is why the
genotypes/ varieties did not perform in the same way in the locations.
The significant effects of genotype × location interaction mean squares
that were observed (Table 5) in most traits also suggest that the
environmental conditions in the two locations influenced the performance
of the genotypes, thus suggesting the need to test genotypes over
different locations across years to ascertain their stability for use as
reliable genetic materials for crop improvement practices. To minimize
error and consequently increase the precision and reliability of
estimates Allard and Bradshaw (1964) suggested increasing the sample
size and number of locations or years during the trials. However, the
disadvantage of this suggestion would be increased costs and delayed
release of results, see Table 3, 4, 5 and 6.
Comparative performance of the 30 genotypes across the two locations for
the 10 traits studied (Table 5) provides a clear indication of the
superiority of some of the genotypes over others. All “sweet sorghum”
genotypes were sweet with sugar concentrations ranging from 6-7.5%
sugar. Good breeding potential therefore exists for genotypes such as
ICSR 93034, E 36-1, samaru 06-4 and crosses/hybrids between ICSA24001 ×
ICSV111, 38A × NR71182, 38A × NR71176 as these performed very well for
both yield and yield components across the two locations. Depending on
the breeding objective, there was a wide range of genotypes to choose
from. For instance if the breeding objective is to produce high yield
and early maturing sweet sorghum varieties, then hybridization between
ICSV 93046 × SAMARU 06-4 or ICSV93046 × E 36-1 or ICSV 700 × SAMARU 06-4
or DANSADAU 07-2 × SAMARU 06-4 which are early maturing and high
yielding genotypes respectively could be promising.
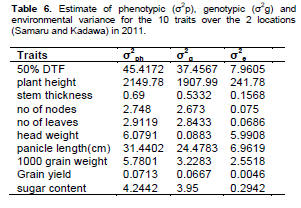
Table 6. Shows estimates of variance components obtained from the
analysis of variance. The estimates of the phenotypic, genotypic,
environmental variances with their standard errors are given. All of the
ten traits studied showed positive genotypic variance. Genotypic
variances had relatively higher estimates compared to environmental
variance estimates. For all but head weight (1.5%) and 1000 grain weight
(56%) genotypic variance was > 75% of phenotypic variance.
Phenotypic and error variances estimates were all positive for all
traits and they had very low standard errors. Plant height, head weight,
50% days to flowering, panicle length and thousand grain weights had
large estimates of phenotypic, genotypic, and error variances. The
variance components showed that most of the characters had higher
phenotypic and genotypic variance estimates than the environmental
variance estimates.
The variance components for the two locations showed that most of the
traits had high phenotypic and genotypic variance estimates (Table 6).
Therefore expressions for most of the characters were genetic, which
indicates advances can be achieved in breeding programs. This finding is
in agreement with the findings of Bello D. et al. (2007), Basu (1981),
and Abu-Gasim and Kambal (1985) for several quantitative traits in
sorghum genotypes. Zaveri et al. (1989) also reported similar results in
pearl millet. Bello et al. (2007) and Lukhele (1981) observed that
higher error or environmental variance estimate for some traits similar
to what was obtained in this study could also be attributed to sample
size.
CONCLUSION
The success of any breeding program depends upon the genetic variation
in the materials at hand. The greater the genetic variability, the
higher would be the heritability. Hence the better the chances of
success to be achieved through selection. Ten traits involving the
leaves, stem, seed and other agronomic parameters were used for this
study. There was considerable variability present in the materials used.
As such these results will be useful for choosing populations to be used
in developing new breeding strategies to improve sweet sorghum
productivity. The variations could be effectively manipulated with
appropriate breeding methods to develop improved varieties, synthetics
and hybrids for use by farmers and industries.
REFERENCES
Abu-Gasim EH, Kambal AE (1985). Variability and interrelationship among
characters in
indigineous grain sorghum of sudan. Crop Sci., 11: 308-309.
Basu AK (1981). Variability and heritability estimate from inter-season
sorghum cross. Ind. J.
Agric. Sci., 41: 116-117.
Bello D, Kadams AM, Simon SY, Mashi DS (2007). Studies on genetic
variability in
cultivated sorghum cultivars in Adamawa State Nigeria. American-Euasian
J. Agric. & Environ. Sci., 2(3): 297-302.
Doggett H (1970). Sorghum 1st edition. Longman, Green and company
limited, London
Harlow.
Duncans D (1955). Multiple range and multiple F-tests. Biometrics, 11:
42.
FAO (2011). FAO available online @ http://www.fao.org/ accessed
February, 2011.
Olanuga AG (1979). Clay mineralogy of soils in Nigerian Tropical Savanna
Regions. Soil Sci.
Soc. Am. J., 43: 1237-1242.
Owunubi J, Abdulmumin J, Malgwi S, Mu’azu S (1991). Review of soil water
balance studies of the Sudano-sahelien zone of Nigeria. In soil water
balance in the Sudano-sahelian zone (Proc. Niamey workshop, Feb. 1991).
Singh PK, Chaudhary SD (1985). Biometrical methods in quantitative
genetics analysis.
Khalyani New Delhi, India, pp 318.
Zaveri PP, Phul PS, Dillon BS (1989). Observed and predicted genetic
gains from single and multi-trait selections using three mating designs
in pearl millet. Plant Breed. Abstr., 60: 127-132.
|
